| 23-Feb-16 | Price | Change | % Change |
| Gold Price, $/oz | 1,222.30 | 12.80 | 1.06% |
| Silver Price, $/oz | 15.24 | 0.06 | 0.37% |
| Gold/Silver Ratio | 80.230 | 0.547 | 0.69% |
| Silver/Gold Ratio | 0.0125 | -0.0001 | -0.68% |
| Platinum Price | 942.70 | 15.90 | 1.72% |
| Palladium Price | 500.25 | 1.40 | 0.28% |
| S&P 500 | 1,921.27 | -24.23 | -1.25% |
| Dow | 16,431.78 | -188.88 | -1.14% |
| Dow in GOLD $s | 277.90 | -6.17 | -2.17% |
| Dow in GOLD oz | 13.44 | -0.30 | -2.17% |
| Dow in SILVER oz | 1,078.55 | -16.42 | -1.50% |
| US Dollar Index | 97.46 | 0.07 | 0.07% |
 |
| 3 Day Gold Price Chart |
 |
| 30 Day Gold Price Chart |
 |
| 5 Year Gold Price Chart |
 |
| 3 Day Silver Price Chart |
 |
| 30 Day Silver Price Chart |
 |
| 5 Year Silver Price Chart |
And as much as I rail on Wall Street pimps for stocks, I don't want to become merely a pimp for silver and gold prices. I try to tell you what I see in charts. My deep-seated bias, however, is for silver and gold, so I'll usually put the best read possible on it. I WANT y'all to buy silver and gold, and not merely because I sell it. Studying 4,500 years of history and monetary law, I know how this latest episode of fiat money will end, after over 100 years defrauding the public. The dollar and its system will evaporate, after destroying the fortunes of millions of honest people.
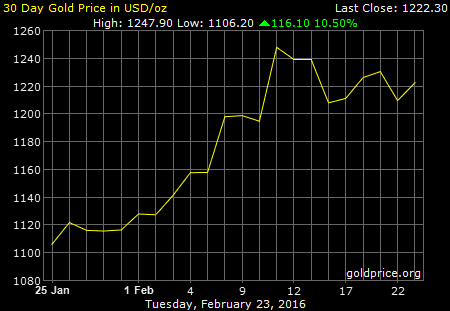
True to their everlasting ability to make me look like no more'n a nat'ral born durn fool from Tennessee, silver and GOLD PRICES rose yesterday against my expecting them to stumble. As I said, there's a 50/50 chance every day.
Here's another interpretation of silver and gold charts: a bullish flag. That is, the sideways pennant or flag that the price of gold has painted in the last 7 trading days is a bullish flag. And since the rule is that "flags always fly at half mast," you could expect gold to jump another $193 (distance from $1,071 - $1,264) from its low at $1,202.50, or $1,395.50, give or take a dime. I think that's less likely than a downward correction first, but these chart patterns don't come with a label that predicts the outcome.
Come on, Moneychanger, which is it, up or down? Durned if I know. Since I want to be buying silver and gold here anyway, I'm not too worried about buying and watching it drop $30 - $40. I would buy it if it closes above $1,264 because that would signal a breakout, or I would buy it if it drops below $1,200. and I wouldn't think twice about it either way.
Nearer that US dollar gets to the green-glowing Kryptonite of its 20 and 50 DMAs (93.38 and 98.14), the slower it moves. Jumped 77 basis points yesterday, but only seven today, to close at 97.46. Sort of like a teenager taking his date out for a ride in his new car, only to blow a head gasket on the way. Embarrassing.
Euro did nothing, down 0.1% at 1.1037, but the Yen jumped 0.7% to 89.21. Those Japanese Nice Government Men have a warty problem. Yen's rallying.
Stocks hit their 50 DMA, mired down hard, and stomped on reverse. Dow peeled off 1.14% (188.88 points) to 16,431.78. S&P skidded 1.25% (24.23 points) to 1,921.27. Those 50 DMAs also lie right atop resistance at 16,500-16,600 and 1,950. Yesterday might have marked the end of stock's upward correction. Dwindling volume since the 11 February low whisper loudly, "Weak as jailhouse Kool-Aid."
Your prayers for my wife are graciously answered, as Susan tells me her eye is 90% of normal today with far less pain. Thank you.
Aurum et argentum comparenda sunt -- -- Gold and silver must be bought.
- Franklin Sanders, The Moneychanger
The-MoneyChanger.com
© 2016, The Moneychanger. May not be republished in any form, including electronically, without our express permission. To avoid confusion, please remember that the comments above have a very short time horizon. Always invest with the primary trend. Gold's primary trend is up, targeting at least $3,130.00; silver's primary is up targeting 16:1 gold/silver ratio or $195.66; stocks' primary trend is down, targeting Dow under 2,900 and worth only one ounce of gold or 18 ounces of silver. or 18 ounces of silver. US $ and US$-denominated assets, primary trend down; real estate bubble has burst, primary trend down.
WARNING AND DISCLAIMER. Be advised and warned:
Do NOT use these commentaries to trade futures contracts. I don't intend them for that or write them with that short term trading outlook. I write them for long-term investors in physical metals. Take them as entertainment, but not as a timing service for futures.
NOR do I recommend investing in gold or silver Exchange Trade Funds (ETFs). Those are NOT physical metal and I fear one day one or another may go up in smoke. Unless you can breathe smoke, stay away. Call me paranoid, but the surviving rabbit is wary of traps.
NOR do I recommend trading futures options or other leveraged paper gold and silver products. These are not for the inexperienced.
NOR do I recommend buying gold and silver on margin or with debt.
What DO I recommend? Physical gold and silver coins and bars in your own hands.
One final warning: NEVER insert a 747 Jumbo Jet up your nose.