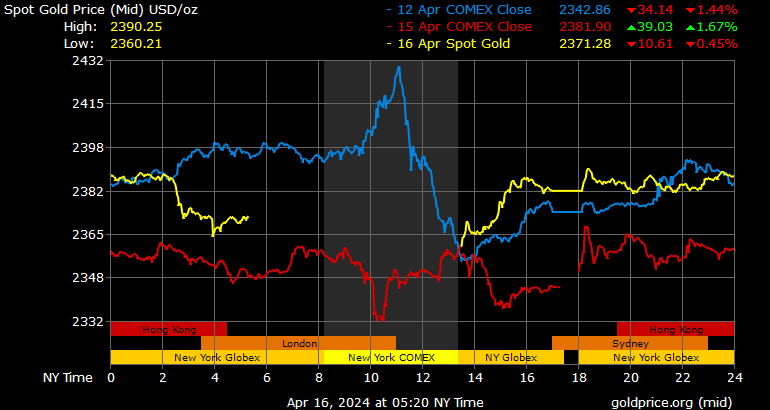
Gold Price Close May 29th : 978.80
Change: -17.10 or -1.7%
Silver Price Close Today : 15.376
Silver Price Close May 29th : 15.60
Change: -22.40 cents or -1.4%
Gold Silver Ratio: 62.55
Gold Silver Ratio May 29th : 62.74
Change: -0.20 or -0.3%
Dow Industrial: 8,763.13
Dow May 29th : 8,500.33
Change: 262.800 or 3.1%
US Dollar Index: 80.677
US Dollar May 29th: 79.317
Change: 1.360 or 1.7%
Gold's chance to break through $1,000 this week were cut short by Tiny Tim Geithner's love-fest with the Chinese. I heard that when he addressed a Chinese crowd and said their "investment" in US government debt was safe, the crowd laughed. Yet he squeezed out some sort of communiqué that implied the Chinese would continue taking licks from the US Dollar. That was enough to send the sleepy US dollar up 100 basis points, then down about the same on Thursday, and up again today 126 basis points to 80.68.


Gold and Silver Prices confirmed my yesterday's suspicions by dropping today to their Wednesday lows. To recap this week's price activity it was approximately this: Wednesday gold down $20 and silver down 60c; Thursday, gold up $20 and silver up 58c; today, Gold down $20 and silver down 50c. Now what does all this sand in our eyes really hide?

On the weekly chart the silver price has broken out of the downtrend that had held it captive from the February high. Momentum indicators there do not appear overbought. On the daily chart, however, the same indicators are hovering near the top of the overbought range. Yet the daily chart breathes no gloom. Rather, it appears to have broken out now above the February high, and after a good run needs to rest, correcting to 14.40 - 14.80. Then, after 3 - 4 weeks it will begin climbing again, although the summer doldrums may drag out that time a bit.

Likewise, gold's weekly chart shows indicators long removed from overbought, but daily chart is calling for a correction. Once gold crosses $1,000 it will dash for $1,300.00. At extreme low of this correction gold price MIGHT reach 920 - 930, but 940 seems more likely.

Add this: the GOLD/SILVER RATIO broke through 68 resistance and has fallen nearly to 61. This is foaming-at-the-mouth bullish for silver and gold prices.
The source of all this vibration is the US DOLLAR INDEX. Today's dollar action gives the chart the look of a V-bottom. It should rally about 4 weeks till it reaches the brick wall of 82 and falls like your checking balance the week before Christmas. Then the frenzied flight out of the buck and into gold will re-commence.
Stocks have cracked (but only cracked) the door of the Dow's 200 day moving average (8,709) which generally marks the upper range of a rallying bear market. Yes, the Dow can still exceed its 200 DMA and trade there a while, but it won't last long.
Argentum et aurum comparenda sunt -- -- Gold and silver must be bought.
- Franklin Sanders, The Moneychanger
The-MoneyChanger.com
© 2009, The Moneychanger. May not be republished in any form, including electronically, without our express permission.
To avoid confusion, please remember that the comments above have a very short time horizon. Always invest with the primary trend. Gold's primary trend is up, targeting at least $3,130.00; silver's primary is up targeting 16:1 gold/silver ratio or $195.66; stocks' primary trend is down, targeting Dow under 2,900 and worth only one ounce of gold; US$ or US$-denominated assets, primary trend down; real estate in a bubble, primary trend way down.