| 22-May-15 | 29-May-15 | Change | % Change | |
| Gold Price, $/oz. | 1,204.00 | 1,189.40 | -14.60 | -1.2 |
| Silver Price, $/oz. | 17.03 | 16.684 | 0.346 | -2.0 |
| Gold/Silver Ratio | 70.699 | 71.290 | 0.591 | 0.8 |
| Silver/gold ratio | 0.0141 | 0.0140 | -0.0001 | -0.8 |
| Dow in Gold $ (DIG$) | 313.03 | 313.03 | 0.00 | -0.0 |
| Dow in gold ounces | 15.14 | 15.14 | 0.00 | -0.0 |
| Dow in Silver ounces | 1,070.58 | 1,079.52 | 8.94 | 0.8 |
| Dow Industrials | 18,232.02 | 18,010.68 | -221.34 | -1.2 |
| S&P500 | 2,126.06 | 2,107.39 | -18.67 | -0.9 |
| US dollar index | 96.11 | 96.97 | 0.86 | 0.9 |
| Platinum Price | 1,147.90 | 1,111.00 | -36.90 | -3.2 |
| Palladium Price | 784.00 | 776.75 | -7.25 | -0.9 |
 |
| 3 Day Gold Price Chart |
 |
| 30 Day Gold Price Chart |
 |
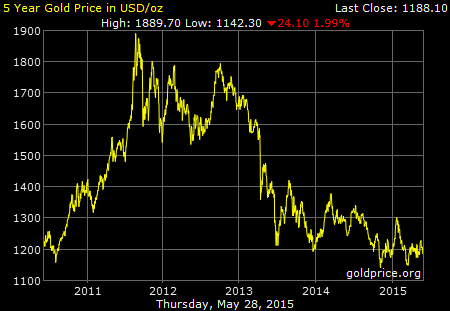
| 5 Year Gold Price Chart |
 |
| 3 Day Silver Price Chart |
 |
| 30 Day Silver Price Chart |
 |
| 5 Year Silver Price Chart |
Today marks both week-end and month-end. I'll talk about the month below, but the week was also interesting. Contrary to the expectations of many, silver and gold prices did not collapse in a heap, but lost chump change.
Today the PRICE OF GOLD added $1.30 to $1,189.40. While SILVER PRICE climbed 3.1 cents to $16.684. For the month, both silver and gold prices closed higher.
 |
| Silver Price |
 |
| Gold Price |
If the even-sided triangle is the pattern ruling silver and gold prices, they will not break that upper triangle boundary, and will turn around when they hit it. On Monday that's $16.50 for silver and $1,170 for the price of gold, so those are good buy targets. If these were any markets but silver and gold, mired in pessimism after a 4 year correction, everybody would be jumping at them.
If I'm wrong, they can (1) sink to the triangle's bottom boundary (on Monday $1,145 and $16.15) or (2) sink much further. A guess says to November lows at $1,130 and $15.00.
Dow lost as much as gold. Dollar index had a surge, but that may have been no more than a correction to its foregoing fall. Greek ghost continues to hang over everything. I wish they'd go ahead and default, as they must in the end anyway, and get it over with. Bear always in mind and never forget that this Greek crisis is a crisis only because they owe money to the big banks. If they owed it to you or me, they'd just stiff us and none of the euro-muckety-mucks would say boo.
Let's focus first on the US dollar index, as all fiat moneys are a never failing fountain of overflowing woe. The dollar index shot up Tuesday and Wednesday to make a perfect 61.8% correction of the fall from 100.27 on 13 April to 93.15 on 17 May. It hit 97.88, closed 97.48. Since then it has backed off and not quite fallen below 96.50 support.
Two interpretations are possible. No. 1, the dollar's correction from April through May was only a correction in a larger uptrend, which the dollar is now resuming on its way to 109. No. 2, the dollar's uptrend from July 2014 to April 2015 was driven by speculative, trend following money. Because a high exchange rate kills US competitiveness in the export market, industry will rebel at a high dollar and the Fed, heroic and courageous as usual, will cave and let the dollar sink again. Therefore, the dollar's upward move ended in April.
The market will tell us only when the dollar index either exceeds this recent high or falls through 96.50 support. Today it lost 8 basis points to end at 96.97.
Who in his right mind will buy euros now with the Greek crisis unresolved? Nobody much. However, the pattern on the euro chart with a gap down, a little trading sideways, then another gap down looks like a completed downmove. Euro rose today 0.23% to $1.0988.
The yen crumbled this week, breaking down with a mighty GAP! Out of its 6 month trading range. Floor had been 82.25, but the yen fell as low as 80.35, and ended down another 0.16% today to 80.58. Japanese Nice Government Men are managing the yen's exchange rate down to the earth's molten core, depreciating as fast as they can to steal a march on American exports.
The rally in US interest rates that began mid-April played out this week. Ten year treasury note closed below its 200 DMA 3 days running. Today it lost another 1.64% and close at 2.095%. Confirming that fall the 30 year bond yield fell this week below its 20 DMA and today closed at its 200 DMA at 2.847%. Looks like the party's over till next time.
What snide things can I say about stocks? Say, Moneychanger, what have you got
Say, Moneychanger, what have you got against stocks? Aren't you a capitalist?
Well, I'd have nothing against stocks if there were a real market in stocks, but the present market 'tis no more than a puff job by the Federal Reserve. Its rise has nothing to do with the underlying economy, which is sick as a plague victim with the flu. Hence, my snideness, yea, seasoned with snark.
Stocks managed to rise this month only because they had such a terrible month in April. Yes, the Dow and S&P 500 made new highs this month, but by millimeters and the gains were so slick they couldn't hold on to them. Dow Transports broke six month support at 8500 and sank to a new low today at 8,299.75, cascading like Niagara Falls. Yesterday the Shanghai Exchange, which has been in a frenzy since last July, lost 4.6%, and today fell again. German Dax has been creamed since its April high, and any close below today (11,413.82) will break the uptrend line from October 2014. London's FTSE is rolling over like the US markets.
Today the Dow lost 115.44 (0.64%) and closed at 18,010.68. After all the festivities, all the up days and down days, the Dow lost 221.34 this week. S&P lost 13.4 (0.63%) today and ended 2,107.39, 18.67 lower than last Friday.
For stocks, the wad's been shot, the die's been cast, the jug has been corked. Remember the proverb, "Sell in May and go away." Summer is not a happy time for stocks, and in their strong season they have proven unable to make a credible continuation of their six year bull run. Whoa! What's that up roosting up in them trees? Izzat buzzards?
Blast! Did I forget to mention that even the yankee government's lying numbers had to be revised today to reduce previously reported puny growth of 0.2% to a 0.7% shrinking.
 |
| Dow in Gold |
 |
| Dow in Silver |
Y'all probably laugh at me for clinging to those gator jaws, but I'm telling y'all, "The jaws of the gator grind slow, but they grind exceeding fine."
West Texas Intermediate Crude walked through its uptrend line on 7 May but against the normal expectation of a plunge, has traded sideways around its 20 DMA. Today it closed above that 20 DMA again. Big question here is whether the double bottom earlier this year followed by a rally marked the long decline's end, or only a pause in the plunge. Another inflation market, Copper, has long since negated its earlier late-April early May rally, and may have broken the uptrend line from January today. Oil and copper tumbling don't do silver and gold prices any good.
Y'all enjoy your weekend.
Aurum et argentum comparenda sunt -- -- Gold and silver must be bought.
- Franklin Sanders, The Moneychanger
The-MoneyChanger.com
© 2015, The Moneychanger. May not be republished in any form, including electronically, without our express permission. To avoid confusion, please remember that the comments above have a very short time horizon. Always invest with the primary trend. Gold's primary trend is up, targeting at least $3,130.00; silver's primary is up targeting 16:1 gold/silver ratio or $195.66; stocks' primary trend is down, targeting Dow under 2,900 and worth only one ounce of gold or 18 ounces of silver. or 18 ounces of silver. US $ and US$-denominated assets, primary trend down; real estate bubble has burst, primary trend down.
WARNING AND DISCLAIMER. Be advised and warned:
Do NOT use these commentaries to trade futures contracts. I don't intend them for that or write them with that short term trading outlook. I write them for long-term investors in physical metals. Take them as entertainment, but not as a timing service for futures.
NOR do I recommend investing in gold or silver Exchange Trade Funds (ETFs). Those are NOT physical metal and I fear one day one or another may go up in smoke. Unless you can breathe smoke, stay away. Call me paranoid, but the surviving rabbit is wary of traps.
NOR do I recommend trading futures options or other leveraged paper gold and silver products. These are not for the inexperienced.
NOR do I recommend buying gold and silver on margin or with debt.
What DO I recommend? Physical gold and silver coins and bars in your own hands.
One final warning: NEVER insert a 747 Jumbo Jet up your nose.