| 31-Jul-14 | Price | Change | % Change |
| Gold Price, $/oz | 1,281.30 | -13.60 | -1.05% |
| Silver Price, $/oz | 20.37 | -0.18 | -0.90% |
| Gold/Silver Ratio | 62.89 | -0.10 | -0.15% |
 |
| 3 Day Gold Price Chart |
 |
| 30 Day Gold Price Chart |
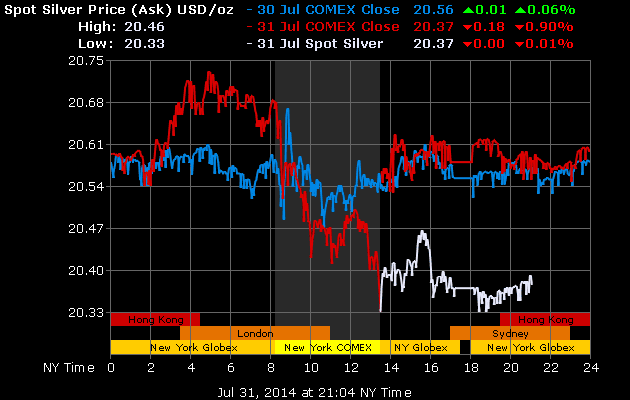 |
| 3 Day Silver Price Chart |
 |
| 30 Day Silver Price Chart |
Around 9:30 a.m. Eastern time when the devil starts to get busy in New York, sellers broke gold about $1,294 and it fell clean below $1,290. Stairstepped down the rest of the day.
The SILVER PRICE did not look anything like that. Before New York opened it climbed to 2075c, then about 9:30 sellers drove it from 2065c to 2055c, and the rest of the day was a losing battle.
Maybe I'm seeing things, but the gold price chart may have an upside-down head and shoulders that began with a left shoulder in May, bottom of the head in June, and a right shoulder forming now. If that's true, it means the present decline should not go much further than $1,265 before it reverses.
Silver has now tumbled again to its 200 DMA (now 2031c). It can catch hold and turn around anywhere between 2000c and 1975c. That ought to come soon.
Silver and gold prices are fixing to hand y'all a bargain basement opportunity. Don't miss it.
Friends, if you are like me and get up every morning thinking, "Today will be like yesterday, only more so." 'Tain't so. Some days, things change. Today things changed in stocks. Serious adults will begin to sell stock positions and put the proceeds into silver and gold.
What a mess! I'm away two days and the devil busts out in Georgia -- and markets.
Most meaningful and pointed event came in the Dow. Not only did it fall 317.06 (1.9%) to 16,563.30, it also broke through -- for the first time -- the uptrend line from the March 2009 low (about 16,730 today). Y'all read that again. Let it sink in.
Today the Dow stands 574.90 or 3.4% below the 16 July 17,138.20 closing high. A 10% correction would take it to 15,424.
Opening from a few points below the 50 DMA (16,877), the Dow began the day dropping and never let up, closing at the low. Next support lies at the last (May) low, 16,341, but the 200 DMA is also nearby at 16,315.
Today's close in the Dow wiped out all but 24 points of ALL the Dow's 2014 gains.
S&P500 dropped more than the Dow, 2% or 39.4, to land at 1,930.67. That sliced clean through the 1,953 50 day moving average like one of them fancy Japanese chopper knives they sell on late-night TV. The uptrend from March 2009 stands today about 1,840. Next support stands at the June low, 1,926.
Since gold and silver also fell today the decline in the Dow In Gold and Dow In Silver were not as dramatic as you might expect. Dow in Gold lost 0.92% to close at 12.91 oz (G$266.18 gold dollars), and fell from near its 50 DMA (13.05) through its 20 DMA (12.97). If the question is, "Has the DiG's upward correction ended?" the answer is "Yes."
Dow in Silver lost 0.75% (6.12 oz) to end at 811.13 oz (S$1,048.73 silver dollars). That is virtually on top of the 811.94 ($1,049.78) 20 DMA. Just below at 805.27 oz (S$1,041.16) stands the 200 DMA. When the DiS breaks that, gravity will get ugly.
Yea, let us keep score, let us chalk up on this, July's last day, gains for the year. Dow +0.1%; Dow Transports +10.1%; Dow Utilities +9.9%; S&P500 +4.7%; Nasdaq Comp +4.6%; Nasdaq 100 +8.4%; Russell 2000 -3.7%; Wilshire 5000 +3.6%; various gold stock indices, up over 18%; gold + 6.6%; silver + 5.3%; platinum +6.9%; palladium + 21.9%; US dollar index +1.8%.
Also in the last two days the 10 year treasury yield has shot up through resistance and the downtrend line from the 31 Dec 2013 high. Ended at 2.556%. Reason assigned by the media is that investors believe the FOMC's latest hot air and a lying government jobs report today showing more employed and rising labor costs mean the Fed will have to raise interest rates sooner than June 2014. Interest rates need to rise over 2.75% before they'll make Mother Janet Yellum start fanning her face with her apron.
Yesterday the Japanese yen dove head first. It had broken the lower boundary of the long narrow triangle slightly, and simply dropped like your wife's cubic zirconium wedding ring straight down the drain. Flat today at 97.27.
Euro did not lose its cool, but dropped only 0.05% to $1.3389. Its nosedive will come another day, maybe soon.
Meanwhile the US dollar index made good on its threat to rally and proved it yesterday with an 81.51 close Rose only 3 basis points today to 81.54. This promises a rally to at least 82.75, maybe higher, but first may back off a couple of days.
Thanks most kindly for all your emails affirming y'all are praying for my sick friend, Daniel Freemon. Susan and I spent a long time in the hospital with him. Doctor is not sure whether he has encephalitis or a tick borne disease (Rocky Mountain Spotted Fever or ehrlichia). Daniel's wife died last November after a two day illness, and he has a 7 year old daughter. Please pray that God would graciously heal him.
Aurum et argentum comparenda sunt -- -- Gold and silver must be bought.
- Franklin Sanders, The Moneychanger
The-MoneyChanger.com
© 2014, The Moneychanger. May not be republished in any form, including electronically, without our express permission. To avoid confusion, please remember that the comments above have a very short time horizon. Always invest with the primary trend. Gold's primary trend is up, targeting at least $3,130.00; silver's primary is up targeting 16:1 gold/silver ratio or $195.66; stocks' primary trend is down, targeting Dow under 2,900 and worth only one ounce of gold or 18 ounces of silver. or 18 ounces of silver. US $ and US$-denominated assets, primary trend down; real estate bubble has burst, primary trend down.
WARNING AND DISCLAIMER. Be advised and warned:
Do NOT use these commentaries to trade futures contracts. I don't intend them for that or write them with that short term trading outlook. I write them for long-term investors in physical metals. Take them as entertainment, but not as a timing service for futures.
NOR do I recommend investing in gold or silver Exchange Trade Funds (ETFs). Those are NOT physical metal and I fear one day one or another may go up in smoke. Unless you can breathe smoke, stay away. Call me paranoid, but the surviving rabbit is wary of traps.
NOR do I recommend trading futures options or other leveraged paper gold and silver products. These are not for the inexperienced.
NOR do I recommend buying gold and silver on margin or with debt.
What DO I recommend? Physical gold and silver coins and bars in your own hands.
One final warning: NEVER insert a 747 Jumbo Jet up your nose.


