| 2-Apr-15 | 10-Apr-15 | Change | % Change | |
| Gold Price, $/oz. | 1,200.90 | 1,204.60 | 3.70 | 0.3 |
| Silver Price, $/oz. | 16.686 | 16.37 | 0.316 | -1.9 |
| Gold/Silver Ratio | 71.971 | 73.586 | 1.615 | 2.2 |
| Silver/gold ratio | 0.0139 | 0.0136 | -0.0003 | -2.2 |
| Dow in Gold $ (DIG$) | 305.77 | 309.93 | 4.16 | 1.4 |
| Dow in gold ounces | 14.79 | 14.99 | 0.20 | 1.4 |
| Dow in Silver ounces | 1,064.56 | 1,103.26 | 38.70 | 3.6 |
| Dow Industrials | 17,763.24 | 18,060.41 | 297.17 | 1.7 |
| S&P500 | 2,066.96 | 2,101.77 | 34.81 | 1.7 |
| US dollar index | 97.79 | 99.66 | 1.87 | 1.9 |
| Platinum Price | 1,153.80 | 1,170.00 | 16.20 | 1.4 |
| Palladium Price | 746.00 | 775.75 | 29.75 | 4.0 |
 |
| 3 Day Gold Price Chart |
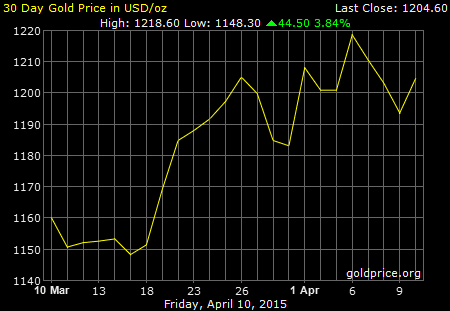 |
| 30 Day Gold Price Chart |
 |
| 5 Year Gold Price Chart |
 |
| 3 Day Silver Price Chart |
 |
| 30 Day Silver Price Chart |
 |
| 5 Year Silver Price Chart |
From the dismal breakdowns yesterday, the GOLD PRICE rose $11 (0.9%) to $1,204.60, well over the morale-busting $1,200 level. Silver added 20.6 cents (1.27%) to close $16.37 on Comex. That was a "paint-the-tape" close for sure, since silver rose above $16.50 in the aftermarket & didn't trade near $16.37 for longer than it took the black shirts to say "Close!"
Why am I buoyed by today? Gold hit that uptrend line from the March low and bounced! It's above its 20 DMA and 50 DMA ($1,204.20). It has climbed back above $1,20, & that bounce from the low $1,190s was strong. Buyers wouldn't let it languish there, so support from below is pushing gold up.
The SILVER PRICE had broken yesterday through its trading channel's bottom boundary, but today threw a leg over that line and bounced back over the fence. Closed slightly below the 20 & 50 DMAs, which are running together ($16.52 & $1.653).
In short words, yesterday's breakdowns FAILED to hold, and a failed breakdown is a bullish -- one longs to say "most bullish" -- sign.
 |
| Gold/Silver Ratio |
Today's trading implies (does NOT guarantee) that silver & gold prices intend to keep on rallying a while, and that this week's trip below $1,200 may have been the last.
 |
| Platinum Price |
 |
| Palladium Price |
'Tis instructive to remember that on 27 March someone wrote, "Unless stocks can scrabble back above the March high, the plunge has begun, the end of the long Fed-sponsored stock bull market." Although they have recovered some, two weeks later stocks remain well below the March high. Silver & gold have spent two weeks wheel-spinning, although the numbers really don't tell this week's heroic story. Platinum & palladium are climbing out of the pit of infamy.
Stocks finally managed to move a little today. Dow added 101.68 (0.57%) to 18,060.41. S&P500 jumped 0.51% (10.59) to 2,101.77.
Always have to look out for taking facts out of context -- context is everything. Doesn't matter if you're a 6'4" girl in a population that averages 7'10", you're still not tall.
Likewise, step away from the numbers & look at them charted. Dow remains in a plain downtrend since the March highs with two higher highs and two lower lows. S&P500 ahs sketched a long, narrow even-sided triangle, but above are lower highs. Next week the S&P500 would need to exceed 2,110 to o'erleap that downtrend line (upper triangle boundary). Dow would have to beat 18,120 - 18,130. Possible, but hasn't happened yet, & looked pretty puny this week.
 |
| Dow in Silver |
 |
| Dow in Gold |
US dollar index yesterday pierced the downtrend line & surged. Today it rose again, 20 basis points (0.20%) to 99.6. This begs the forecast that the dollar index is aiming for a double top with March's 100.71, although it could stop higher or lower. Chart on the right.
 |
| US Dollar |
Yet again the euro covered itself with shame, dropping 0.5% to $1.0605. Wrecked hopes of a rally this week. Yen gained 0.36% to 83.21, still keeping its head down & scooting sideways, avoiding attention.
Last few days I've been meaning to tell y'all that premiums on common fractional gold coins have jumped. Sovereigns (0.2354 troy ounce) have gained about $8 in premium, French & Swiss 20 francs the same. Since these coins are favored gold investment forms in Europe, & since small coins have been disappearing for a couple of years, one is tempted to speculate that more Greeks & other Europeans are bailing out of the Euro. Just a guess.
Y'all enjoy your weekend.
Aurum et argentum comparenda sunt -- -- Gold and silver must be bought.
- Franklin Sanders, The Moneychanger
The-MoneyChanger.com
© 2015, The Moneychanger. May not be republished in any form, including electronically, without our express permission. To avoid confusion, please remember that the comments above have a very short time horizon. Always invest with the primary trend. Gold's primary trend is up, targeting at least $3,130.00; silver's primary is up targeting 16:1 gold/silver ratio or $195.66; stocks' primary trend is down, targeting Dow under 2,900 and worth only one ounce of gold or 18 ounces of silver. or 18 ounces of silver. US $ and US$-denominated assets, primary trend down; real estate bubble has burst, primary trend down.
WARNING AND DISCLAIMER. Be advised and warned:
Do NOT use these commentaries to trade futures contracts. I don't intend them for that or write them with that short term trading outlook. I write them for long-term investors in physical metals. Take them as entertainment, but not as a timing service for futures.
NOR do I recommend investing in gold or silver Exchange Trade Funds (ETFs). Those are NOT physical metal and I fear one day one or another may go up in smoke. Unless you can breathe smoke, stay away. Call me paranoid, but the surviving rabbit is wary of traps.
NOR do I recommend trading futures options or other leveraged paper gold and silver products. These are not for the inexperienced.
NOR do I recommend buying gold and silver on margin or with debt.
What DO I recommend? Physical gold and silver coins and bars in your own hands.
One final warning: NEVER insert a 747 Jumbo Jet up your nose.